Series · University of Idaho
Weed Biological Control Series
From what classical biocontrol is, to obtaining agents and monitoring release sites: the whole program, one step per episode.
Open the playlist →GIS · Dashboards · AI tooling · Research & outreach · Since 2007
Maps, dashboards and AI tooling for the people fighting invasive weeds: weed districts, CWMAs, state programs and the growers who work the ground. Two sisters who cover the whole range, from the schema to the screen to the published report, and both still answer the phone.
Every number on this page is live, from real client builds. Nothing is a mock-up.
This is the kind of view we build for every client: your own data, live, readable at a glance. Not a screenshot.
Wasatch Range, Ogden Valley · MIA Consulting
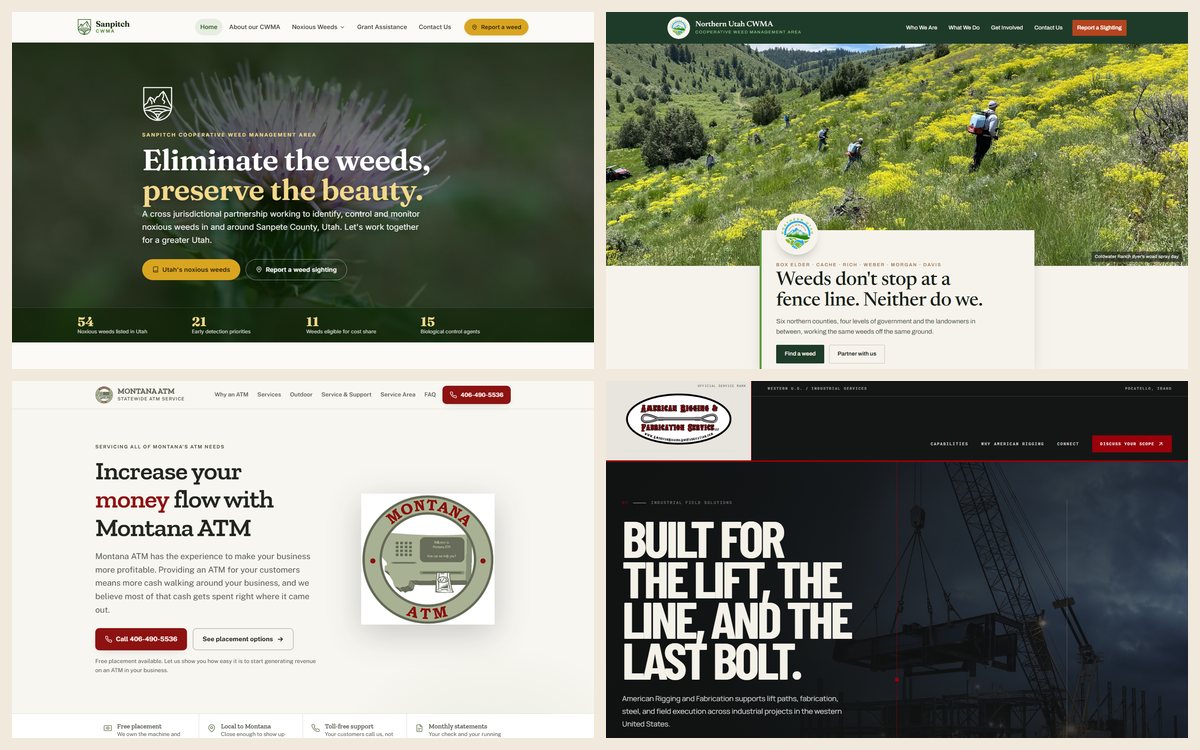
Built and in use
Every card below shows a number pulled live from the real site, right now. Click through and use it.
 live
liveNine pages, 69 weed profiles, a live map with class and species filters, and three forms. Static, no CMS, nothing to patch.
 live
live79 pages generated from data files. The map paints a bundled snapshot instantly, then merges anything new from ArcGIS.
 live
liveThe Survey123 form the teams already use feeds a leaderboard, totals and a pull-station map, five minutes behind reality.
 live
liveAll 29 counties shaded by report volume, with a per-county drill-down: this year, species, share of the state, top five weeds.
 live
liveEvery release site classified improving, stable or worsening by change in weed cover, with AI writing the plain-language site narratives.
 live
liveA multi-state invasive-species dashboard embedded on westernweed.org, built for the committee that coordinates weed programs across the western United States.
Figures refresh hourly from each project's own data service.
How we work
The same five capabilities every vendor lists, told the way a weed program actually lives them. One small team carries the whole list, so nothing is handed between vendors and lost in the gap.
Field crews and volunteers record what they see. We design the forms and the schema so a record is useful the day it's made, not after a cleanup.
Survey123 · EDDMapS · ArcGIS · PostGISThe data work →AI that removes paperwork, not judgement: photograph a field form and get a structured record; ask in plain language and get the map. Every extraction ends at a confirmation screen.
Claude · vision intake · audit trailWhere it helps →Public and internal web maps that query the authoritative layers directly and stay fast on one bar of service in a truck.
MapLibre · Leaflet · ArcGIS RESTHow we build them →Dashboards that treat change over time as the primary fact. Improving, stable, worsening, at a glance, with the chart right there when you want to check.
Self-hosted · Chart.js · CSV exportDashboards you own →Field guides, fact sheets, technical reports, program assessments, journal articles and film: what a program is judged on, made for the people who will use them in the field.
USDA publications · peer-reviewed journals · videoThe publications →Watch
Short, plain-spoken educational videos for the people who actually do the work. Press play; they run right here.
From what classical biocontrol is, to obtaining agents and monitoring release sites: the whole program, one step per episode.
Open the playlist →An intro to basic plant identification, then a short film for dozens of invasive plant species.
Open the playlist →An explanation of the irrigation process for small acreage properties. Original script, editing and animation.
Watch on YouTube →Videos play from YouTube's privacy-enhanced player and only load when you press play.
Where we work
Dashboards in ten states and three regional programs. Education and outreach material spanning North America. And the World Weed Biocontrol Catalog documenting weed biocontrol releases worldwide.
Dashboards
Shaded states have an MIA dashboard in service; pins mark a program's home base.
Pins are approximate; they mark an office or program headquarters, never a field site.
We host what we build
Every site above runs on infrastructure we operate: certificates, mail, DNS, backups, security scans and the boring monthly updates. If you've ever lost a week to a hacked WordPress or a lapsed renewal, this is the line item that ends it.
Published and in use
A few of the field guides, references and papers. The full list, with roles and links, is on the publications page.
Start a project
A map, a dashboard, a data model, an intake tool, a field guide, a film. Or all of it.